When I was a facilities manager (FM), I had to make decisions around whether to repair or replace a facility asset (chiller, reverse osmosis unit, UPS, etc.). Some of these decisions I was authorized to make alone, but others had to go up the chain of command for higher-level approvals. Regardless of who ultimately made the decision, I had to be able to justify the repair or the replacement.
The decision to repair or replace
Like many FMs, a part of me just wanted new equipment because I had the perception that newer equipment would give me fewer headaches. Another part of me was driven by the need to reach the goal of having no failures and the perception that newer equipment would have less chance of failure. (Besides, new equipment is just cool.)
In reality, as the facilities manager, I was working for companies that needed to make a profit or were held to some financial requirement and it drove me to build a decision framework that aligned with their financial goals. While I hoped company leaders would understand the language of engineering — and some did — it was more often the case that they understood the world in terms of finance, which required me to put the justification in financial terms.
The buy vs. repair spreadsheet
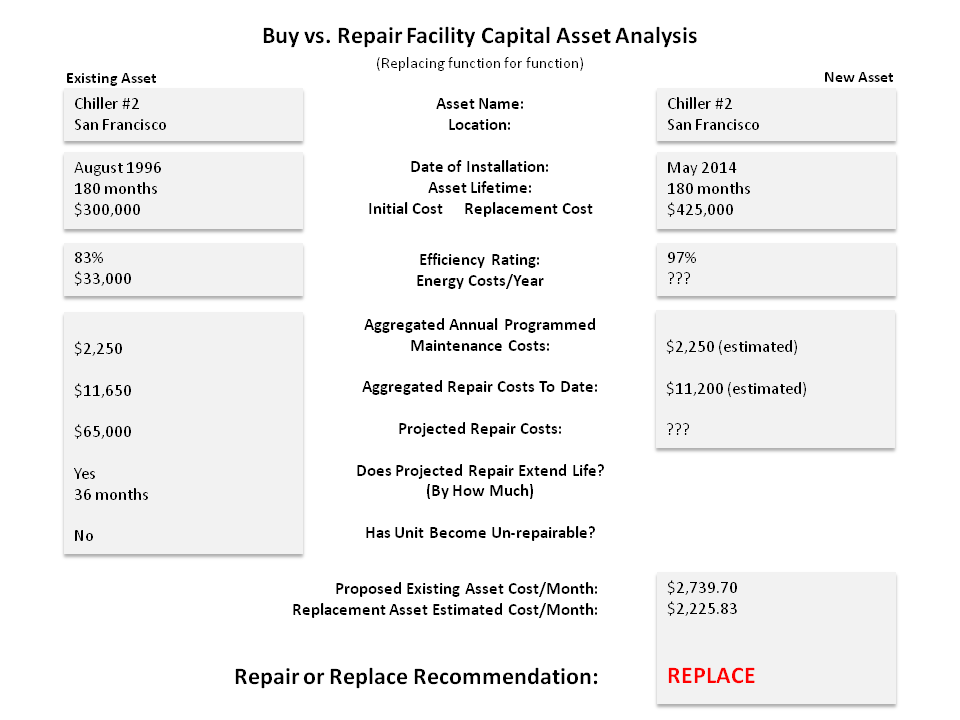
I developed a tool to help me prepare the financial analysis. Here’s what it looks like (click on the image to expand): 
Download the spreadsheet
The spreadsheet (download here: Buy vs. Repair EOL Capital Asset Analysis – Sapient Services, LLC) can help you make the analysis. It allows you to input most of the terms and can be modified for pretty much any facilities asset. The image above is meant to simplify understanding of the analysis, but the Calculations & Constants Sheet is the supporting (second) sheet of the spreadsheet.
Many of the calculations take place on the second sheet, and the data about the financial side of the business is kept in the second sheet as well so it can be factored into the decision. (I inserted notes at various points to explain the entry or what the calculation is doing and why.)
Everything is calculated except the rate of inflation, which is a percentage average over the applicable time period. If you are working with an asset that is 15 years old, for example, you would use the average rate of inflation over those 15 years.
The spreadsheet is meant to look purely at the financial cost of the unit to do its function. Basically, if the cost of repairing the unit drives the cost above the expense of the replacement, then it represents a financial justification for replacement.
Calculations & Constants Sheet
| Rate of Inflation | 2.50% |
| Number of years: | 17.15 |
| Number of months in operation | 206 |
| Early asset retirement penalty | $ — |
| Number of months to use in equations | 206 |
| Initial Cost to today’s value: | $458,125.15 |
| Current Monthly cost (straight-line depreciation) | $2,226.69 |
| New Asset Monthly Cost (SLD) | $2,361.11 |
| Adjustment for efficiency delta (if any) | $(385.00) |
| Adjusted New Asset Monthly Cost (SLD) | $1,976.11 |
| Current Asset Lifetime Monthly Cost | $2,470.82 |
| Projected Asset Lifetime Monthly Cost w/repairs | $2,739.70 |
| New Asset Est. Lifetime Monthly Cost | $2,225.83 |
| New Asset Est. Lifetime Monthly Cost w/early penalty | $2,225.83 |
Again, this is just one tool in the decision process, but hopefully it will help you quantify the buy/replace decisions you need to make in your facility. Please leave a comment if you have any questions or thoughts about the process.


Follow Us!